Is Poland
really developing?
383 strategic investments – 212 current and 171 earlier landmarks added as background. Each ≥ PLN 500 million or deemed strategic. Completed, under construction, and the ones that failed. Governments of every stripe. Zero politics, sources only. Judge for yourself.
01Now
Right now 83 major investments are under way.
Not “someday.” Now. Roads, rail, factories, ports, power plants – all at once, across the country.
See all 83 in the filterable list
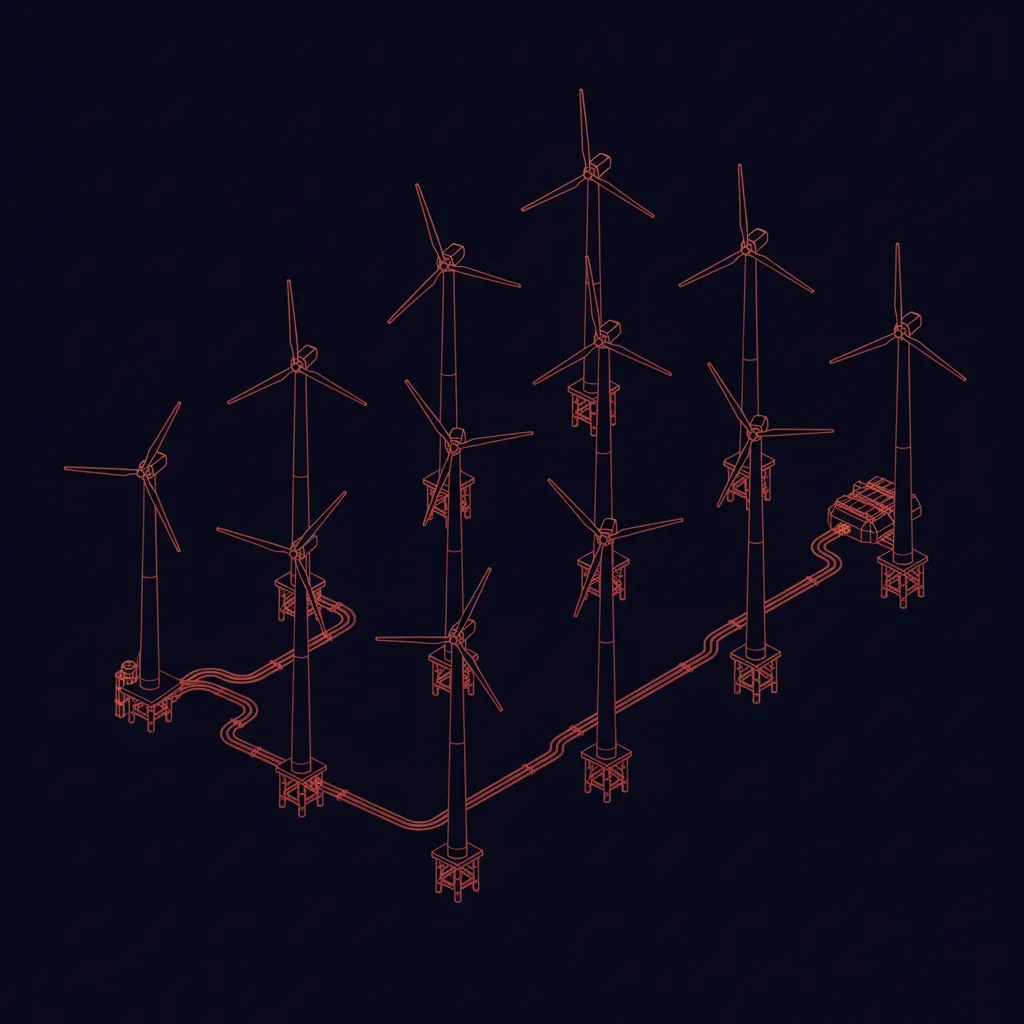 Baltic Power Offshore Wind Farm20 bn
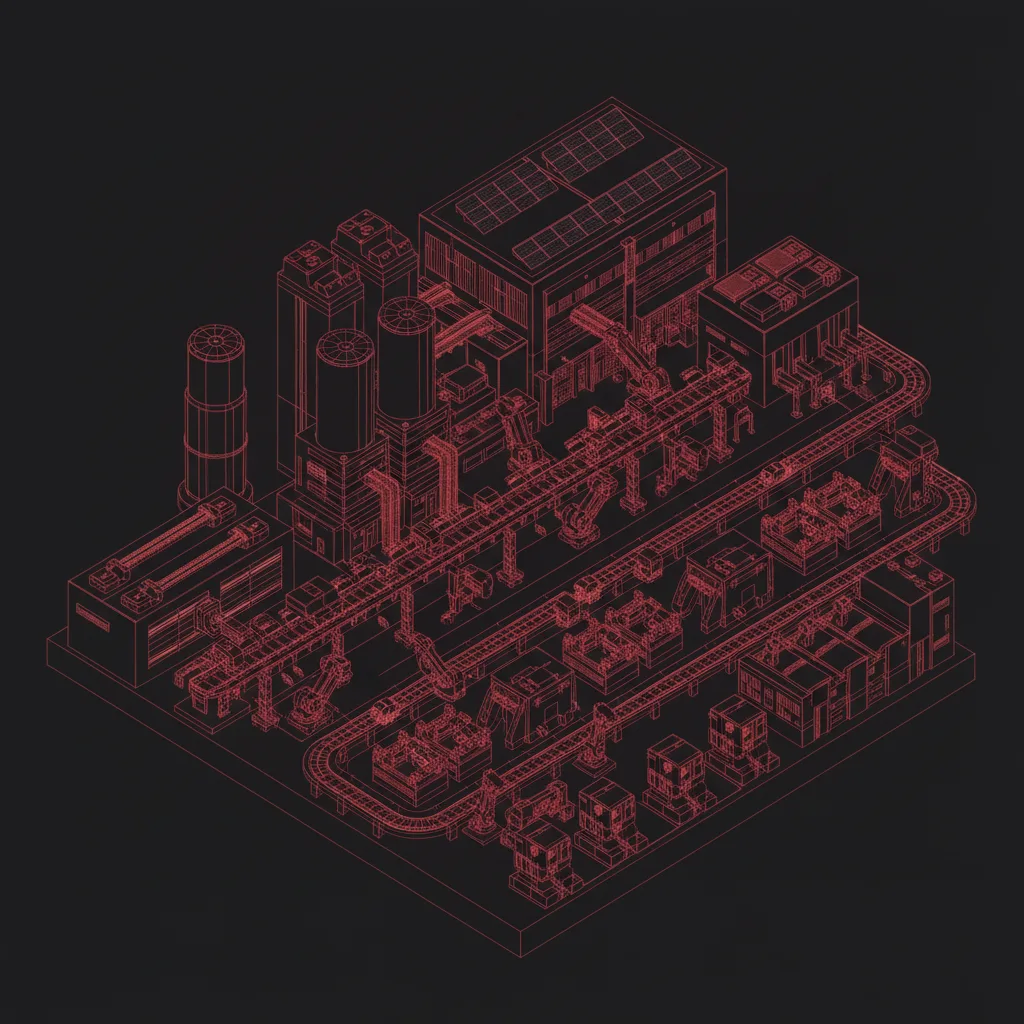 Polimery Police (PDH and polypropylene installation)7.2 bn
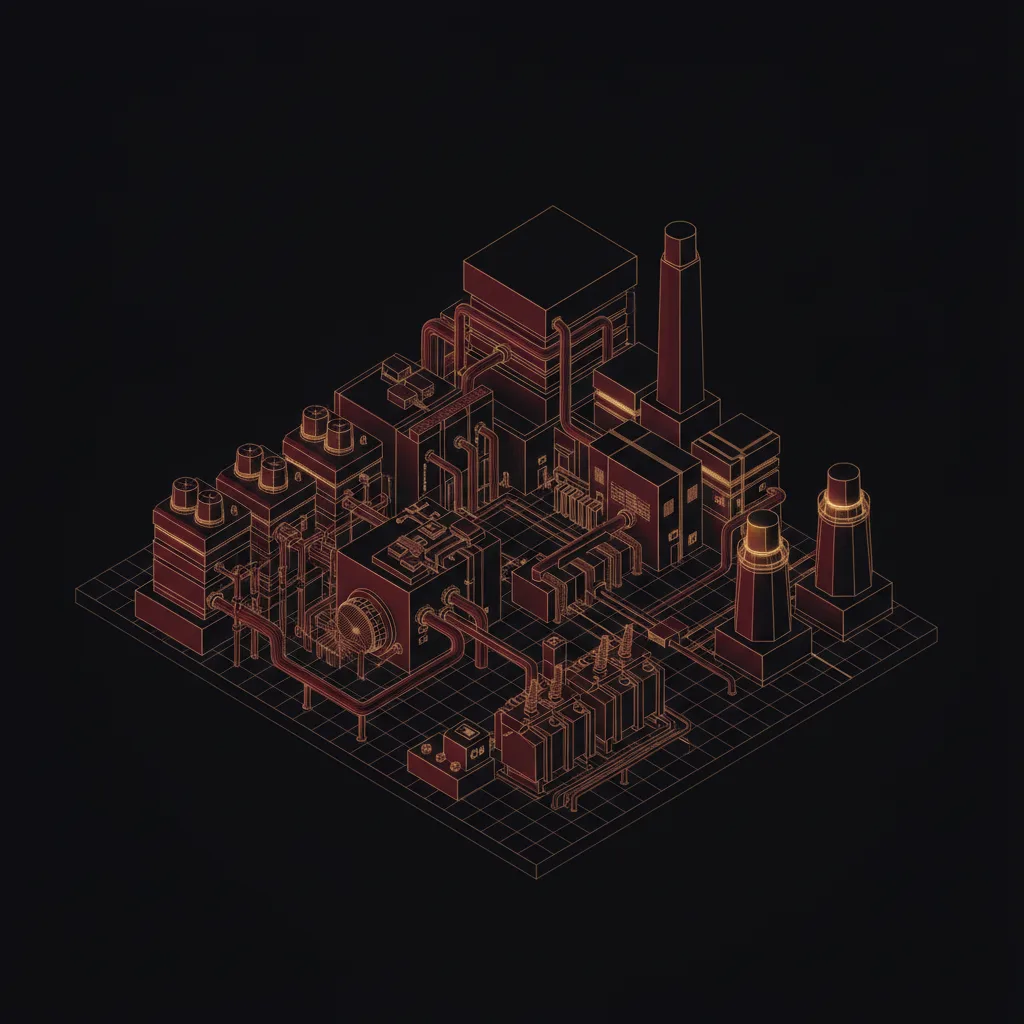 CCGT Ostrołęka combined-cycle gas power plant2.9 bn
 Modernisation of Leopard 2A4 tanks to the Leopard 2PL standard2.4 bn
 CCGT Grudziądz gas-and-steam power plant (Unit I, 563 MW)2.0 bn
 Tram to Mistrzejowice – KST Stage IV (Krakow, PPP)1.9 bn
 Central Integrated Clinical Hospital in Poznań0.86 bn
 Reconstruction of the runway and taxiways at Rzeszów-Jasionka Airport (CEF Military Mobility)0.11 bn
 Baltica 2 Offshore Wind Farm30 bn
 National Municipal Wastewater Treatment Programme (KPOŚK)29 bn
 Completion and expansion of Warsaw metro line II (eastern-northern and western sections)10 bn
 IONWAY cathode materials plant (Umicore + PowerCo/VW) in Nysa7.3 bn
 Mercedes-Benz electric van factory (VAN.EA) in Jawor4.3 bn
 Nowy Rybnik gas-and-steam power plant (CCGT Rybnik, 882 MW)3.0 bnBaltic Power Offshore Wind Farm20 bnPolimery Police (PDH and polypropylene installation)7.2 bnCCGT Ostrołęka combined-cycle gas power plant2.9 bnModernisation of Leopard 2A4 tanks to the Leopard 2PL standard2.4 bnCCGT Grudziądz gas-and-steam power plant (Unit I, 563 MW)2.0 bnTram to Mistrzejowice – KST Stage IV (Krakow, PPP)1.9 bnCentral Integrated Clinical Hospital in Poznań0.86 bnReconstruction of the runway and taxiways at Rzeszów-Jasionka Airport (CEF Military Mobility)0.11 bnBaltica 2 Offshore Wind Farm30 bnNational Municipal Wastewater Treatment Programme (KPOŚK)29 bnCompletion and expansion of Warsaw metro line II (eastern-northern and western sections)10 bnIONWAY cathode materials plant (Umicore + PowerCo/VW) in Nysa7.3 bnMercedes-Benz electric van factory (VAN.EA) in Jawor4.3 bnNowy Rybnik gas-and-steam power plant (CCGT Rybnik, 882 MW)3.0 bnNowy Rybnik gas-and-steam power plant (CCGT Rybnik, 882 MW)3.0 bnMercedes-Benz electric van factory (VAN.EA) in Jawor4.3 bnIONWAY cathode materials plant (Umicore + PowerCo/VW) in Nysa7.3 bnCompletion and expansion of Warsaw metro line II (eastern-northern and western sections)10 bnNational Municipal Wastewater Treatment Programme (KPOŚK)29 bnBaltica 2 Offshore Wind Farm30 bnReconstruction of the runway and taxiways at Rzeszów-Jasionka Airport (CEF Military Mobility)0.11 bnCentral Integrated Clinical Hospital in Poznań0.86 bnTram to Mistrzejowice – KST Stage IV (Krakow, PPP)1.9 bnCCGT Grudziądz gas-and-steam power plant (Unit I, 563 MW)2.0 bnModernisation of Leopard 2A4 tanks to the Leopard 2PL standard2.4 bnCCGT Ostrołęka combined-cycle gas power plant2.9 bnPolimery Police (PDH and polypropylene installation)7.2 bnBaltic Power Offshore Wind Farm20 bnNowy Rybnik gas-and-steam power plant (CCGT Rybnik, 882 MW)3.0 bnMercedes-Benz electric van factory (VAN.EA) in Jawor4.3 bnIONWAY cathode materials plant (Umicore + PowerCo/VW) in Nysa7.3 bnCompletion and expansion of Warsaw metro line II (eastern-northern and western sections)10 bnNational Municipal Wastewater Treatment Programme (KPOŚK)29 bnBaltica 2 Offshore Wind Farm30 bnReconstruction of the runway and taxiways at Rzeszów-Jasionka Airport (CEF Military Mobility)0.11 bnCentral Integrated Clinical Hospital in Poznań0.86 bnTram to Mistrzejowice – KST Stage IV (Krakow, PPP)1.9 bnCCGT Grudziądz gas-and-steam power plant (Unit I, 563 MW)2.0 bnModernisation of Leopard 2A4 tanks to the Leopard 2PL standard2.4 bnCCGT Ostrołęka combined-cycle gas power plant2.9 bnPolimery Police (PDH and polypropylene installation)7.2 bnBaltic Power Offshore Wind Farm20 bn
Records in progress that are at the construction or commissioning stage. Announcements, permits and tenders are left out, however close their stated deadline. Sorted by momentum (stage × proximity to opening).
02Leap
What we’ve already built.
Not plans – things that stand and work. 66 completed megaprojects of the contemporary era worth ~PLN 122 billion, across a dozen fields at once. For scale: motorways and express roads grew 7.6× in one generation (from nearly 720 km in 2004 to 5,466 km in 2025).
show all sectors (+11)
Value of completed projects by sector, contemporary era only. The catalogue holds 226 records with status “completed”, but earlier landmarks are collected selectively, not systematically, so they sit outside this chart. The split is curatorial and is not a cut-off by delivery date. Figures nominal, prices from various years, not adjusted for inflation; amounts recorded in a foreign currency at the fixed rate (EUR 4.30 / USD 4.00 / SEK 0.38). Nuclear and offshore wind are excluded – they arrive here only once delivered. This is “value-by-stage”, not “total cost”. Express roads 720→5,466 km. GDDKiA: 2004 figures, 2025 figures.
Where these figures come from
What that PLN 122 billion is made of: 86.3 bn in announced budget envelopes (70%, 43 rec.), 20.9 bn in contract values (17%, 13 rec.), 15.3 bn in estimates (12%, 6 rec.). These are not settled outlays – every card states its own basis for the figure.
show the source quotes
„Wchodząc do Unii Europejskiej, 1 maja 2004 r., Polska miała blisko 720 km dróg szybkiego ruchu”
GDDKiA, 2004 · GDDKiA – Wspólnota europejska i polskie drogi
„Obecnie kierowcy mogą korzystać z niemal 5466 km dróg szybkiego ruchu, w tym ponad 1894 km autostrad i 3571 km dróg ekspresowych.”
GDDKiA, 2025 · GDDKiA – Podsumowanie 2025 roku
Why separately?
Because only the current era is collected systematically – earlier landmarks are a selection rather than a full sweep, which is why they sit in their own section. Their costs do enter the “value-by-stage” figure, so the headline sum covers both eras.03What’s coming
More is scheduled for 2026–2032 than opened in 2020–2025.
The headline is about one time window, not the whole chart. Counting openings, more of them are already behind us than ahead. Records in progress or planned with no stated opening year get no bar here, so the future sits lower on the chart than the data would put it. By value, the two tallest bars fall in 2035 and 2036, and two records fill most of them, the “Y” high-speed railway and the first nuclear power plant, both on declared dates.
Show the figures (table)
| Year | Delivered % GDP | Planned % GDP | % of GDP | Projects |
|---|---|---|---|---|
| <1995 | 0.38% | 0% | 0.38% | 4 |
| 1995 | 0% | 0% | 0% | 0 |
| 1996 | 1.07% | 0% | 1.07% | 1 |
| 1997 | 0% | 0% | 0% | 3 |
| 1998 | 0.22% | 0% | 0.22% | 1 |
| 1999 | 0.23% | 0% | 0.23% | 2 |
| 2000 | 0.17% | 0% | 0.17% | 1 |
| 2001 | 0% | 0% | 0% | 0 |
| 2002 | 0.26% | 0% | 0.26% | 1 |
| 2003 | 0.19% | 0% | 0.19% | 1 |
| 2004 | 0.06% | 0% | 0.06% | 1 |
| 2005 | 0.2% | 0% | 0.2% | 1 |
| 2006 | 0% | 0% | 0% | 0 |
| 2007 | 0.66% | 0% | 0.66% | 7 |
| 2008 | 0.33% | 0% | 0.33% | 5 |
| 2009 | 0.4% | 0% | 0.4% | 5 |
| 2010 | 0.41% | 0% | 0.41% | 7 |
| 2011 | 1.67% | 0% | 1.67% | 9 |
| 2012 | 1.07% | 0% | 1.07% | 14 |
| 2013 | 1.26% | 0% | 1.26% | 8 |
| 2014 | 1.51% | 0% | 1.51% | 12 |
| 2015 | 1.52% | 0% | 1.52% | 21 |
| 2016 | 0.68% | 0% | 0.68% | 11 |
| 2017 | 1.01% | 0% | 1.01% | 11 |
| 2018 | 0.53% | 0% | 0.53% | 6 |
| 2019 | 1.24% | 0% | 1.24% | 9 |
| 2020 | 0.54% | 0% | 0.54% | 4 |
| 2021 | 1.02% | 0% | 1.02% | 7 |
| 2022 | 0.77% | 0% | 0.77% | 11 |
| 2023 | 0.9% | 0% | 0.9% | 17 |
| 2024 | 0.42% | 0% | 0.42% | 10 |
| 2025 | 0.98% | 0% | 0.98% | 13 |
| 2026 | 0.11% | 1.49% | 1.6% | 26 |
| 2027 | 0% | 1.77% | 1.77% | 16 |
| 2028 | 0% | 1.22% | 1.22% | 18 |
| 2029 | 0% | 0.34% | 0.34% | 12 |
| 2030 | 0% | 1.35% | 1.35% | 13 |
| 2031 | 0% | 1.64% | 1.64% | 4 |
| 2032 | 0% | 1.37% | 1.37% | 8 |
| 2033 | 0% | 0% | 0% | 1 |
| 2034 | 0% | 0% | 0% | 0 |
| 2035 | 0% | 3.18% | 3.18% | 4 |
| 2036 | 0% | 5.26% | 5.26% | 1 |
| 2037+ | 0% | 0% | 0% | 2 |
Each project counts as a share of GDP in the year its amount comes from, not the year it opens. Read on
Projects opened in 2020–2025 sum to ~4.63% (≈0.77%/yr). The 2026–2032 window carries ~9.29% (≈1.33%/yr), almost all of it a declared pipeline rather than delivered openings or annual spending. The chart omits records with no stated opening year, and far more of those are under construction or planned than delivered, so the pipeline reads low here. Future dates are declared dates – some will slip.
How this chart is computed
Sorted by opening year (completed → year delivered; the rest → current planned date). Bar size = share of GDP (cost ÷ nominal GDP of the year the cost figure comes from), not nominal cost – so projects from different eras compare fairly despite inflation and the 1995 redenomination. Size is measured against GDP in the price year where the source gives one; for amounts converted from a foreign currency, the year of the exchange rate; otherwise the year of the cost figure’s date, and where that is missing too, a year from the record’s timeline (delivery first, then the planned date, start and announcement). 0 with a stated price year, 251 from one of the other three. A further 57 projects enter the bars’ counts but carry no recorded cost, so they add nothing to the height: the count rests on 308 records, the height on 251.
macro backdrop – about the economy, not project costs
For “since 1990” context: Poland’s real GDP (constant prices) grew +237% since 1990 – the most in the region (Czechia +81%, Germany +55%). This measures the scale of the economy, not prosperity, and is not project cost. Separately: GDP per capita in PPS rose from 51 to 79% of the EU average (2004→2024). World Bank, Eurostat. Backdrop, not proof. The GDP growth figure we compute ourselves from a World Bank series, the PPS index is read from a Eurostat table, and the road kilometres carry a quote from a primary source. Only that third figure meets the bar every project field has to clear.
04Honestly
Not everything worked. And it’s good that you can see it.
Among the 79 current records that are completed or stopped (cancelled, superseded, paused), 14 did not work out, about 18%. A project under construction or planned has no outcome yet either way, so it is not in the denominator. “Failed” means here: cancelled, superseded, paused, or carrying a shortfall material to the project's scale (established, named by an audit, or under investigation). The full list is longer (21), because it also holds failures among the earlier landmarks (7). The rule does not count delays or overruns, and there are far more of those: where a source speaks about the schedule, 86 of 99 records ran late, and where it speaks about the budget, 25 of 30 are over it. Those two fractions run over the whole database, including records in progress and landmarks. None of these figures is a rate for Polish investment as a whole: the database is a selection, not a random sample, a withdrawn announcement gets its outcome sooner than a finished build, and sources report a slip more often than a deadline kept. The “Failed” pill in the catalogue follows the same rule, and each of these figures can be reproduced from /api/projekty.json and /api/statystyki.json. We show failures with the same source rigour as successes; they’re rarely black-and-white.
This is why the list reads as one-sided in time: a verdict (cancellation, replacement, or an established shortfall) by its nature takes years, so any large investment active today may not have one yet, regardless of when it started. The Central Transport Hub (CPK) and the second nuclear plant are still under way, and the rule above cannot rule on them yet. That does not mean they are faring any better, only that nothing is settled yet.
Warsaw–Radom Airport
95,646 passengers in 2025 against 3,000,000 capacity – 3%
Ostrołęka C Power Plant
~PLN 1.3 billion on a coal unit that was never finished – construction was halted
Izera / the Polish EV
Brand cancelled (PLN 580 million); the company is preparing a different car with Foxconn under a new brand, production 2029
Cross-city rail tunnel in Łódź
The boring shield has stood still since November 2024; the cost grew from about PLN 1.3 billion net to about 2.3 billion
Orlen Olefins III (original scope)
Budget ballooned from PLN 8.3 to as much as 51 billion including infrastructure; PLN 16.8 billion write-off; superseded by the narrower “New Chemistry” (PLN 35.8 billion)
And even these are rarely black-and-white: Izera was cancelled, and the company that developed it is preparing a different car with Foxconn under a new brand. The post-Northvolt battery factory in Gdańsk is not on the list, although its investor went bankrupt: a new owner restarted production there. Every case is in the database – with full context.
Above: 5 examples picked by hand, one per kind of failure – this is not a ranking of losses. All 21 records sit on a page of their own: the full “Failed” list.
05Where
Where it’s being built.
Where it’s being built – by voivodeship. Circle size is the number of projects in the region (not value). The point map and filters are in the “All projects” section.
Tap a region (or hover) to see its breakdown.
Circle colour is the field with the most projects in the voivodeship:Transporttie (several fields with the same count)EnergyDefence
358 projects on the map; circle size = number of projects in the voivodeship (not value). Regional counts add up to more than 358 because 58 projects span several voivodeships. The same applies to the amounts: a multi-region project enters each of them at full value, so the regional figures must not be added up – they come to about 44% more than those records do. 24 sensitive sites are counted at voivodeship level (no precise point). 25 projects have no assigned region – off the map.
06All projects
Now it’s your turn.
Start from a field
9 indexes, each with a summary and the full project list. Filters and the map are below.
383 projects, PLN 1,263 billion
The buckets divide the database with nothing left over: 83 + 226 + 45 + 9 + 20 = 383. The last term is the stopped records: cancelled, superseded or paused. “Failed” (21) is not one more bucket but a cut across them: it covers every stopped record, and beyond those the live or completed ones where a source states a material shortfall. Adding this pill to the rest would therefore count some records twice.
what is momentum?
Momentum = how close a project is to opening: build stage × proximity to its date. “Now” and “home stretch” rank above early plans. Two buckets sit outside that scale because they describe a state rather than a distance from opening: “partly in service” is a project whose first part already runs while the rest is built, and “failed” cuts across the other buckets instead of being one more.